BioSignals · Updated 17 November 2026
Local Reports — Illustrated User Guide
From a folder on your computer to a clear report, graphs and comparisons. For BS_SIGNALS and BS_TRAINING recordings.
The complete parent-folder connection and automatic reopening were verified in Edge. Chrome may stop with AbortError before granting access; use Edge if that happens.
First report in four steps
- Open the generator in Edge.
- Connect the parent folder
C:\BioSignalsonce and allow access. - Select a recording from the list and wait for analysis.
- Review Data Quality, then open Professional Report and print or export.
All report screenshots use artificial DEMO recordings. The values illustrate the interface and do not represent a person or clinical reference. Click an image to enlarge it.
1. Before you start
Save a recording in BS_SIGNALS or BS_TRAINING first. The generator reads existing local CSV files; it does not create a recording or connect to a live sensor.
The usual folders are C:\BioSignals\export and C:\BioSignals\logs. Both can contain subfolders. Keep the related CSV files together and retain their original names. A recording may consist of several files but appears as one entry in the list.
C:\BioSignals
├── export
│   └── … CSV
└── logs
└── … CSV- Use a regular Edge window on the computer containing the recordings.
- Have the recordings available locally. If a recording is still being written, finish it before analyzing or exporting its report.
- Choose the interface language using the language menu at the top.
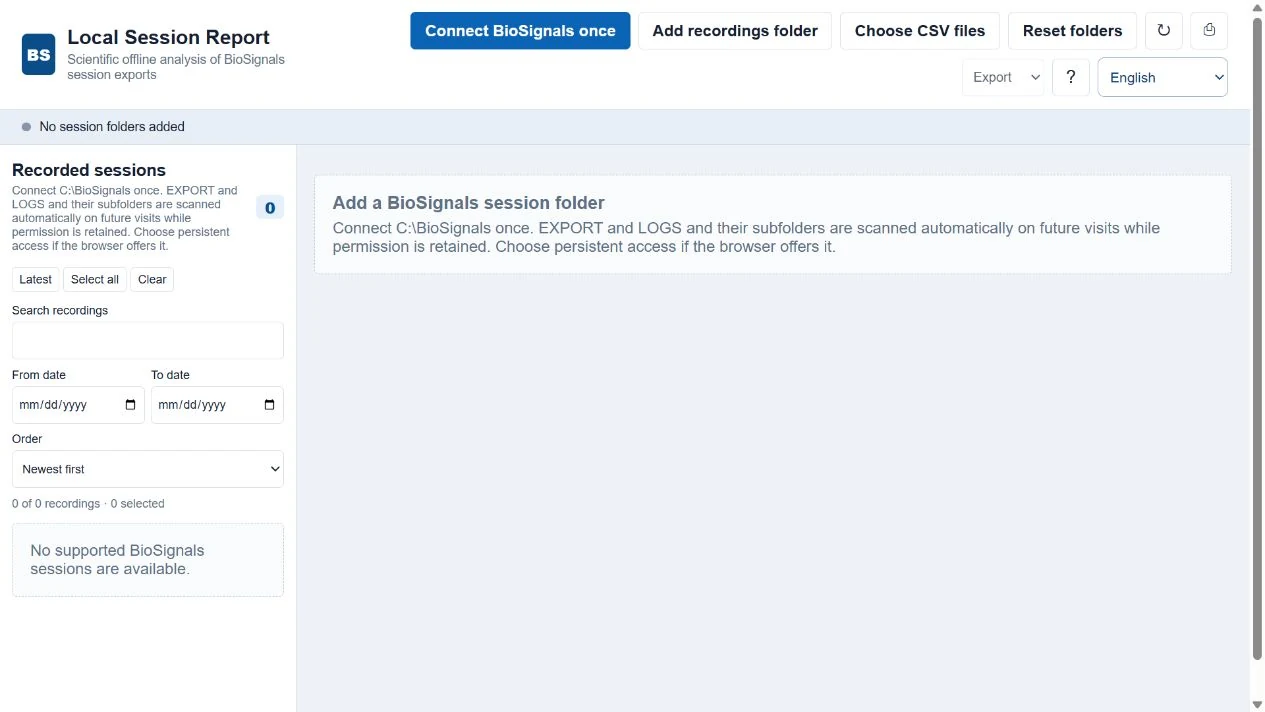
2. Connect the BioSignals parent folder
The first folder permission must be given by you. The page cannot grant itself access. Selecting the parent does not mean scanning every folder beside EXPORT and LOGS: the automatic library traverses these two recording roots and their descendants.
- Click Connect BioSignals once yourself.
- In the folder dialog choose
C:\BioSignals, not the C: drive. Confirm with Select folder. - If Edge asks whether the site may view files, allow access. If access on every visit is offered, choose it to keep the connection. Dialog wording varies by browser version and language.
- Wait for the automatic scan. The status shows folder, CSV, recording and read-error counts. The count of recordings is different from the count of source files.
- A successful connection shows Automatic library connected. The list is ready; analysis starts only after you select a recording.
3. Find and select recordings
The list displays recording date/time, source format, source-file count and total size. Dates are read from supported recording names, with file modification time as a fallback. CSV files belonging to the same supported recording are grouped automatically.
- Use Search recordings to find a date, name, folder or
BS_SIGNALS/BS_TRAININGformat. - From date and To date include the boundary days. Clear these fields if recordings seem to have disappeared. Choose newest-first or oldest-first ordering.
- Tick one recording to analyze it. Latest selects the newest visible recording. Wait for the completion status, especially for large files.
- Select all selects the currently visible list and may require substantial processing. Clear removes selections, not files. The selected count can include recordings hidden by filters.
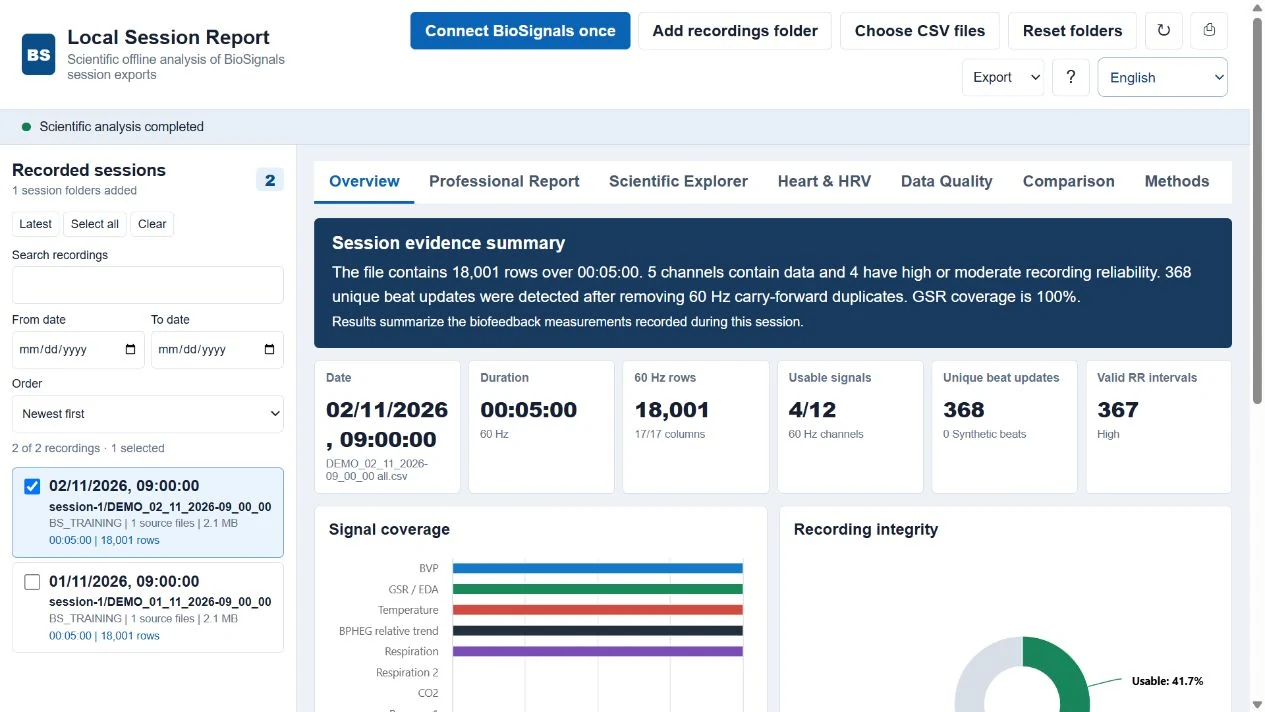
4. Read the Overview
Start with the recording identity and duration. Confirm that this is the intended date and session. The summary includes rows, available channels, unique beat updates and valid RR intervals.
Coverage and integrity charts describe what was captured. Findings summarize the available measurements; channels without usable data remain marked as unavailable. A blank result is not a measured zero.
- Review the signal coverage before drawing conclusions.
- If important channels are missing, open Data Quality and inspect the recording rather than assuming the report failed.
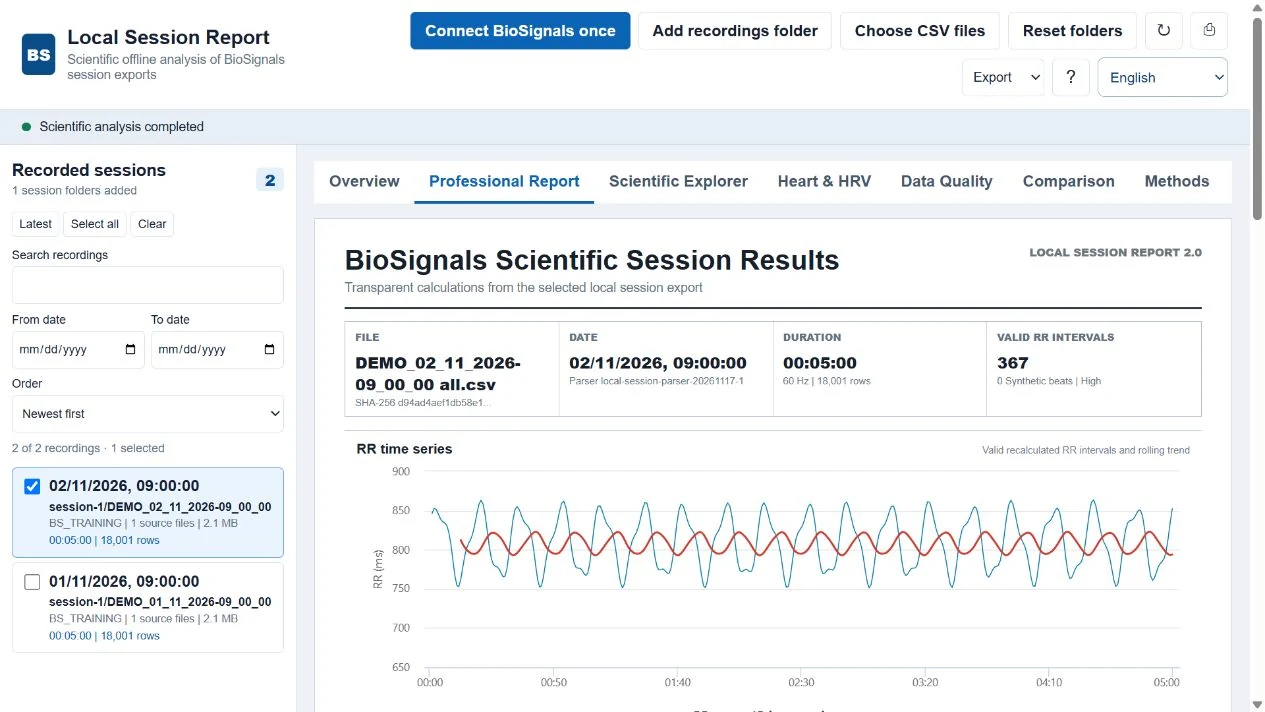
5. Open the Professional Report
Open Professional Report for the consolidated scientific layout. Scroll through the entire report: RR time series, time-domain results, RR distribution, RR spectrum, Poincare SD1/SD2, time-varying HRV and the physiological signal overview.
The report identifies the recording and its available data. Some panels remain empty or limited when the source lacks valid RR intervals or sufficient usable information. The product does not calculate proprietary Kubios PNS/SNS indexes or unverified population norms.
- Check identity, duration and quality first.
- Scroll below the first graph to see the remaining tables and figures.
- Use Print report for a print/
PDFoutput, or Export →HTMLfor a saved report.
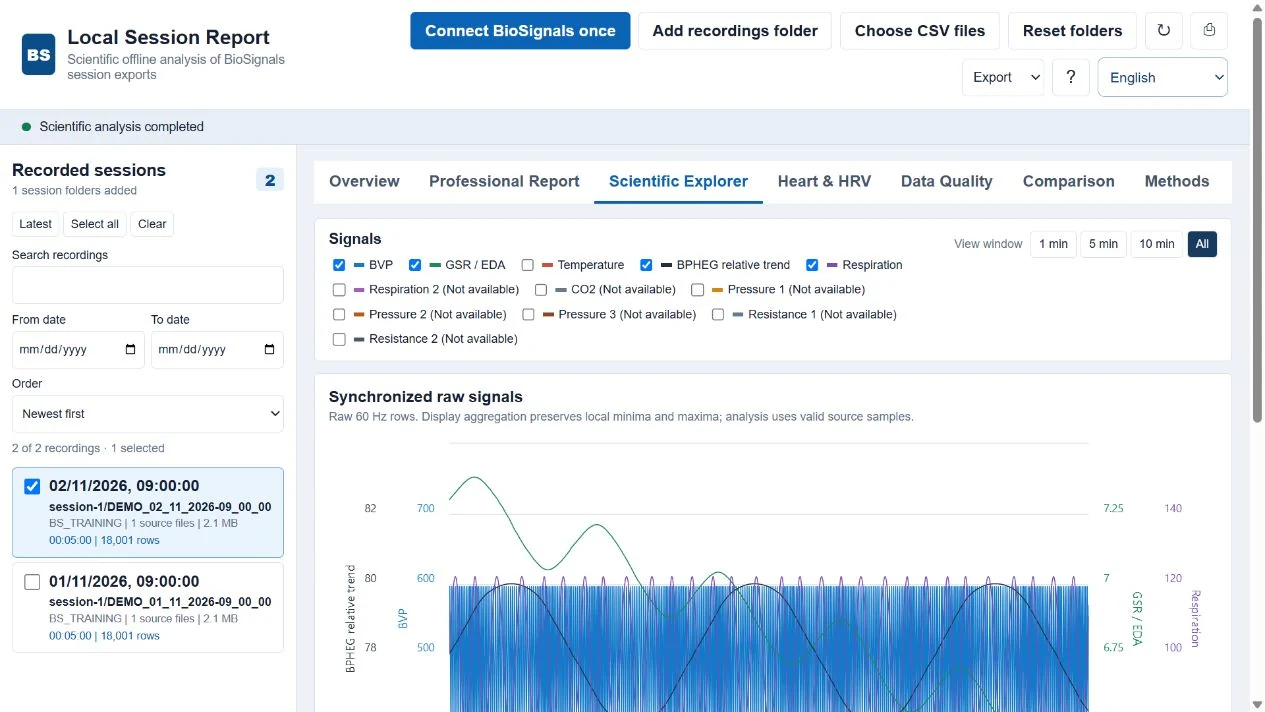
6. Explore the raw signal graphs
Scientific Explorer displays synchronized raw signals from the selected detailed recording. Display aggregation is for viewing; it does not add missing measurements. Signal values retain device units unless independently calibrated.
- Use the signal checkboxes to show only the channels you want.
- Choose 1 min, 5 min, 10 min or All to change the view window.
- Move over a graph to inspect values. Use the chart navigator or available zoom controls to examine a time segment; return to All for context.
7. Heart & HRV
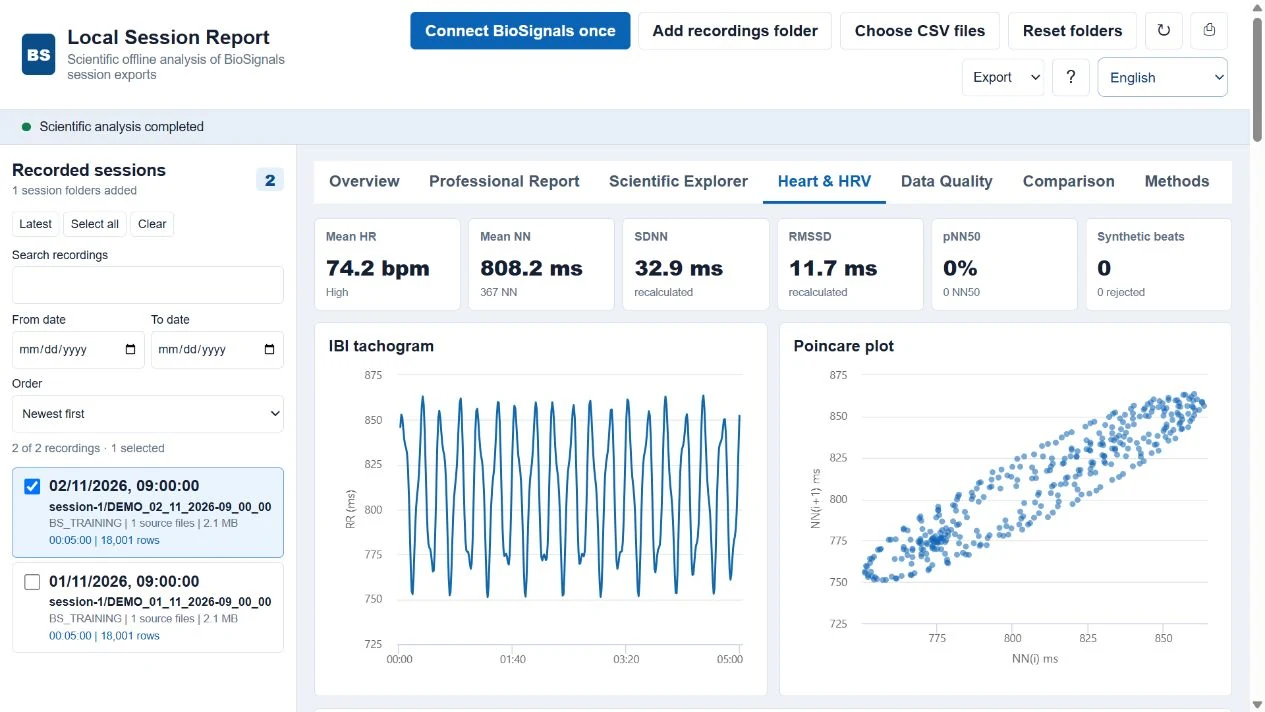
Heart & HRV displays the available recalculated cardiac metrics, IBI tachogram and Poincare plot. The Stored HRV updates table shows values saved in the source when present.
Stored values and values recalculated for the report can differ because their definitions, windows and available source data differ. Read Methods before interpreting a difference. RR and IBI are beat-interval quantities; their tables and exports use milliseconds.
- Check the count of valid RR intervals and recording quality.
- Scroll down to review Stored HRV updates; an empty table means those updates are not available in that recording.
8. Check Data Quality and events
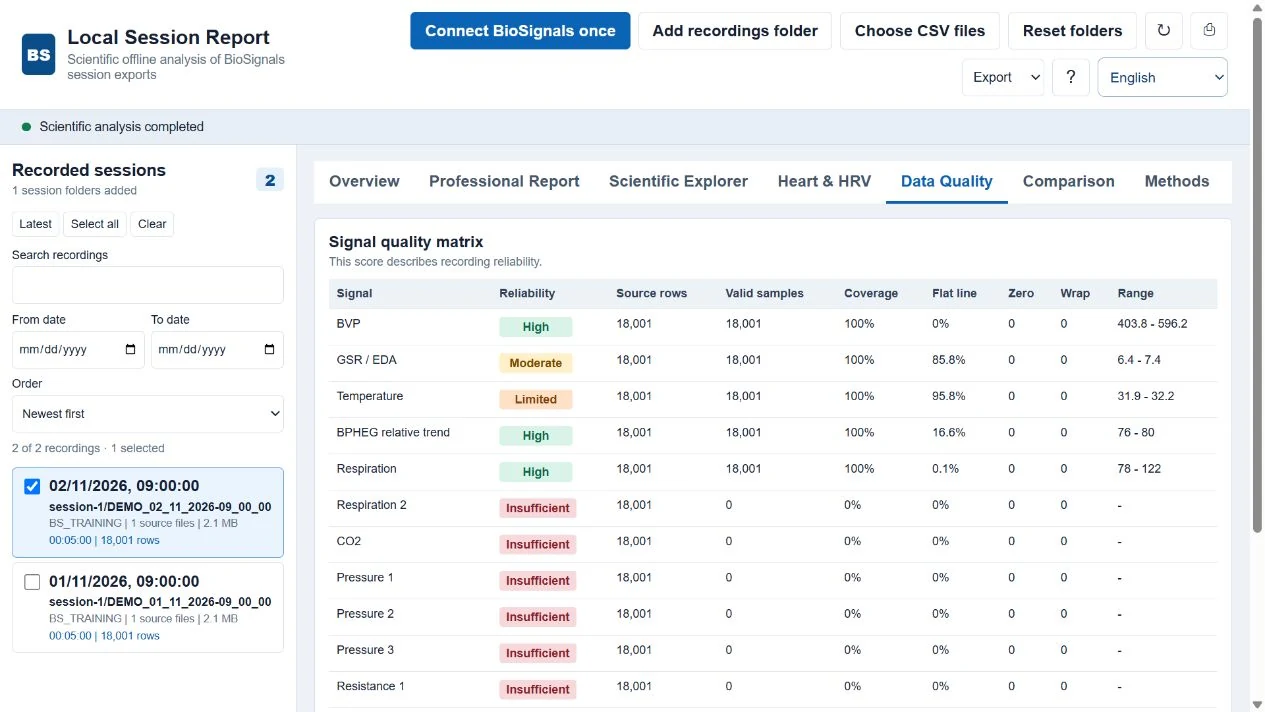
The matrix lists reliability, source rows, valid samples, coverage, flat-line behavior, missing/zero counts and ranges. This is recording reliability, not a health score.
Events and integrity notes can explain gaps, malformed rows or other source limitations. Missing sensors do not become valid measurements merely because a report can be generated.
- Inspect the important channels in the matrix.
- Read the event/integrity notes below it.
- If a file changes or becomes unreadable, finish the recording and refresh; keep the original export files unchanged.
9. Compare several recordings
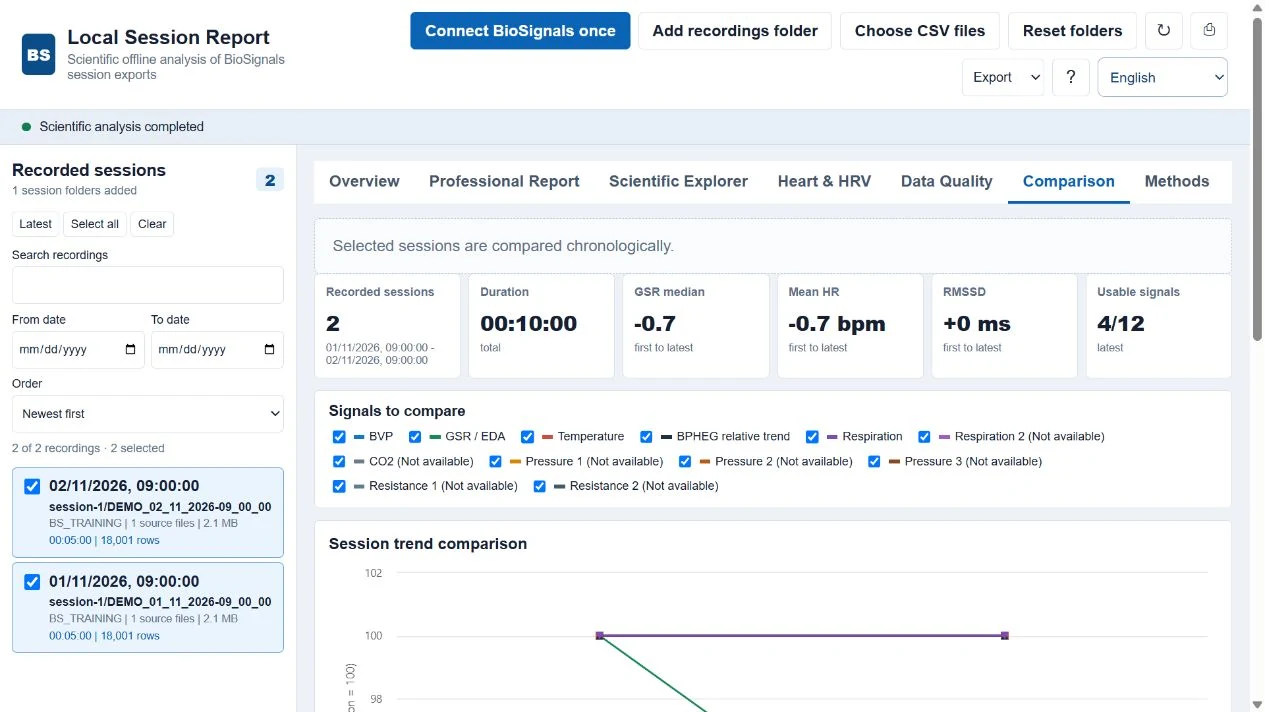
Select at least two recordings, then open Comparison. Recordings are compared chronologically. The detailed single-session views use the newest selected recording; the comparison uses the selected group.
The trend chart normalizes each selected signal to its first valid baseline of 100. This is a relative index, not a percentage of health or proof of improvement. The comparison table preserves measured values, quality and coverage.
- Filter the library to the recordings you intend to compare.
- Tick their checkboxes and wait until analysis completes.
- Open Comparison and choose the signals to include.
- Review the table and stored HRV comparison as well as the chart. Compare similar conditions and usable data; unavailable values are not zeros.
10. Save, print and share a report
The controls are enabled after a usable recording has been analyzed. The export applies to the currently selected recordings, so check your selection before saving.
Printing produces the professional report for the detailed recording, not the comparison table. HTML captures the available report views; JSON and IBI CSV can include the selected group.
- Print: click the printer icon. In the system print dialog choose a printer or Save as
PDF, then inspect the preview before saving. HTML: chooseHTMLin Export. This saves a report snapshot for viewing; it is not a replacement for the original CSV recordings or for the interactive generator.JSON: saves structured report results, quality information, beat/update information and recording identity for further technical use.IBI CSV: saves valid intervals with recording name, elapsed beat time, RR and heart rate.- Keep the original source files as your archive. Check the browser download location and review the saved file before sharing it.
11. Next visits, new recordings and reset
In the same browser profile and website address, the saved folder connection can be reused while permission remains available. A permission is not automatically shared with another browser, profile or website origin.
- On the next visit, wait for the automatic library scan.
- After creating new recordings, click Refresh to scan the connected folders again.
- If the page offers Allow saved folder access, click it and approve access. If needed, use Reset folders and connect
C:\BioSignalsagain. - Reset folders clears the generator’s remembered connections and visible list. It does not delete any recordings from disk.
12. Troubleshooting
Work through the message shown under the toolbar. A file count, recording count and error count answer different questions. For support, send the exact status and browser name, or a screenshot without private information.
| What you see | What to do |
|---|---|
AbortError / folder connection stopped in Chrome | Open the same generator in Microsoft Edge and connect C:\BioSignals there. This is the verified customer route. Repeatedly selecting a folder in a failing Chrome picker does not establish permission. |
| 0 recordings | Confirm the selected parent contains export or logs with supported CSV recordings. Clear search/date filters. Read the status and scan counts. |
| Permission renewal requested | Click Allow saved folder access in the same browser/profile. Approve access; if the saved connection is unusable, reset and reconnect the parent. |
| Read errors or changed/unavailable file | Finish the recording, ensure the files remain on the computer, then refresh. Readable recordings can remain available even if other files fail. |
| No graphs / print or export disabled | Tick a recording and wait for analysis. If still empty, check Data Quality, the source format and the status error. |
| Missing HRV or empty comparison | HRV requires usable beat intervals. Comparison needs at least two selected, successfully analyzed recordings. Some source formats do not include stored HRV updates. |
| Very slow analysis | Select one recording first. Avoid Select all on a large archive. Discovery lists the library; analysis reads selected recordings and can require significant memory. |
| A prompt mentions uploading hundreds of thousands of files | Cancel it. Use Edge’s Connect BioSignals once, which resolves only EXPORT and LOGS. A bulk folder-upload picker is not the intended workflow. |
13. Local data and privacy
Recording contents are read and analyzed locally in your browser. They are not uploaded by the generator. The webpage and public guide pictures are downloaded from the website; documentation pictures contain only artificial demo data.
HTML, JSON, IBI CSV and PDF files that you save may contain personal recording information. You control where you store or share them. Give another person report files only intentionally; keep your original recordings backed up.
14. Interpretation and limitations
These are biofeedback recording summaries, not a diagnosis or treatment recommendation. Reliability and coverage must accompany any interpretation. Device values should not be presented as calibrated physical units without calibration. BPHEG is a relative trend, not cuff blood pressure.
Different sensors, recording lengths and conditions can affect comparisons. No missing channel is reconstructed. Use Methods for the calculation description and ? for the short in-app help. Changing the interface language does not alter source files.
↑ Back to the top15. Before giving the report to someone
- Correct recording and date selected.
- Data quality and unavailable channels reviewed.
- All intended report pages/graphs checked in the saved file or print preview.
- The report is saved in the intended place and shared only with the intended recipient.
Download all six languages (ZIP)
The ZIP contains this guide and its pictures for offline reading; it does not include the report generator or any recordings.